March 23rd, 2017 — Uncategorized
We have added filtering options to the application (with intent to improve further), and are still working on transparency so many data points can be seen all at once. In addition to this, we have begun our second round of surveys. Previous participants have been contacted and requested to complete a new assessment of our updated site. So far, we have received great feedback!
Our first presentation of the semester will take place on Tuesday March 28, in which we share our progress with our professor.
Here is an updated link for anyone who would like to see our updates and progress: http://davidgarcia.co/aneuapptest/trap_og.php
February 28th, 2017 — Uncategorized Tagged february, statistics, updates
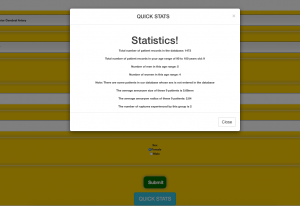
We have used the Bootstrap Library to create a modal for some quick statistics based on the user’s input. Above, you will see some very basic numbers. All averages and numbers come directly from the data in Dr. Cebral’s database. We hope to add a rupture percentage based on the data we have thus far for each “Quick Stat” use, and will be adding informative statistical graphics as well. This pop up window will be retrieved anytime someone presses the button for statistics and will be unique to their specified inputs.
February 28th, 2017 — Uncategorized Tagged february, new look, progress, statistics
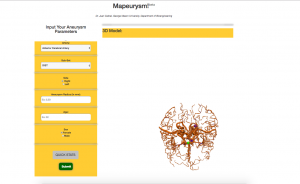
We are still working on transparency of the cases in our database and filtering options for the users, but have been able to add a Quick Stat button and get the input and model on the same page.
This is still a prototype and nowhere near the final version – so just keep that in mind!
We will continue to work out the bugs and on creating the most user friendly version possible!
January 10th, 2017 — Uncategorized
We have spent the last three weeks improving our site and have fixed our input options so that invalid scenarios are impossible to specify – this allows a rendering to be produced every time with no invalid entries or errors.
In addition to this, each team member is focusing on learning more about the languages (PHP, JavaScript, R, etc.) used to further improve the project and allow for progress towards this semester’s final prototype.
December 3rd, 2016 — Uncategorized
The team has begun to finalize the first version of our prototype, and the following figures show the user interface created. Figures 2 and 3 show the desired cross-platform abilities. Further updates on the outputs will be given soon.
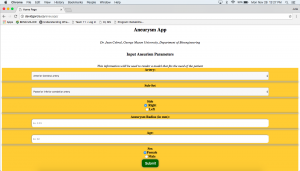
Figure 1: The user interface for this web-application prototype. It includes drop down menus to choose an aneurysm’s location, and the ability for the user to specify side, radius, age, and gender. It is accessible through a web browser. This particular screen shot shows it was opened on a computer in Google Chrome.
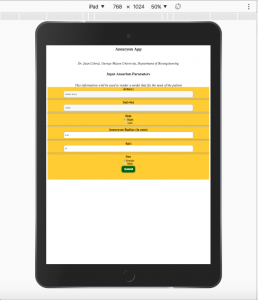
Figure 2: The user interface for this web-application prototype on an Apple iPad. It is the exact same user interface as on a computer, but sized to the dimensions of the iPad. It includes the same options, functions, and interactive rendering.
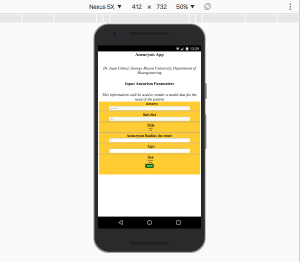
Figure 3: The user interface for this web-application prototype on a Samsung Nexus 5X. It is the exact same user interface as on a computer, but sized to the dimensions of the phone. It includes the same options, functions, and interactive rendering.
November 28th, 2016 — Uncategorized
With our prototype work still in progress, the team has run into some difficulty processing the large amounts of model data. The size of the files has caused our browsers to time out and not process properly. Even with a time delay of 50 seconds, the problem still persists. Alternative methods are being looked into at the moment to counteract this setback and find a quicker method of processing our files and data.
JavaScript was going to be used to process our data originally, which is what produced the setback described. We are now experimenting with PHP to process our data first before feeding it into the JavaScript code. This has been successful thus far: it processes the data more quickly and allows for completion. Further research into other methods is still being done to find the best alternative for the prototype.
We hope to have fixed this problem completely and have our completed prototype with incorporated initial statistics by Friday December 2, 2016.
November 21st, 2016 — Uncategorized
As we are coming to the end of the Fall semester and nearing the end of Senior Design I (BENG 492), we wanted to update you on what we expect our prototype will include by the end of the next few weeks and give credit to the libraries and people who have helped us thus far.
We have set up a web page on a personal server that takes user inputs, chosen from drop down lists. It is accessible through the internet, and thus can be used on any device with an internet connection. From the user inputs, the generic vasculature model (provided by Dr. Cebral) is displayed on the screen with the user input plotted on the model in the proper location. We are still working on the comparison feature that allows a user to see other instances from the database properly. In addition to this, we are working on an interactive statistics page that users may choose to see that will be generated based on their inputs such as age, gender, and location.
The libraries we have used to create this web-application to supplement our code, as of right now, include functions from Three.js, WebGL, and SharkViewer, all three of which are JavaScript libraries. The process carried out by the application is conducted through the use of HTML, PHP, and Javascript. We feel it is important to note that no user information will be stored on our server in an effort to keep protected health information (PHI) private.
We will post again later and update everyone on the metrics we will base our success on and the objectives we hope to meet!
November 21st, 2016 — Uncategorized
We have given our Proposal Presentation to Dr. Bray, Dr. Cebral, and Dr. Salvador-Morales on November 4, 2016 and received feedback that we are working to improve our project and final presentation with.
The team has a basic prototype working – a web display that allows for user inputs. We are currently working on calling the 3D model to the page from these inputs, and making the inputs more interactive through subqueries. In addition to this, statistics have officially begun and we are creating a separate web application for the optional information data that a user may want. We intend to have static data displayed for our demonstration coming up in a few weeks and will continue analysis on this through the end of the semester and well into the Spring.
October 19th, 2016 — Uncategorized Tagged progress
As of 10/15/16, data analysis has begun. Further coding and work is underway to plot known aneurysms from our database against this generic model of a “healthy”, unaffected subject that we received from Dr. Cebral.
Thanks to our mentor, we have access to a database of information that he has been gathering for the past 10 years, and a rendering of a generic vasculature that he is allowing us to use to complete our project.


